The BD FACS Discover S8 is the first imaging-enabling full-spectrum cell sorter in the market. It is a 2-in-1 sorter combining the possibility of sorting on standard fluorescent parameters, like any conventional full spectrum sorter, with imaging features, which can be plotted in histograms and bivariates plots. One major consequence of this transformational advance is that cells can be sorted not only on the proteins that they express but also according to the location of protein expression in the cell.
The S8 has five lasers (349, 405, 488, 561 and 637nm) and 78 algorithmically optimised fluorescent APDs covering the full spectrum. The entire emission spectrum of each fluorochrome is captured across the different modules and then stitched together to create a spectral signature that combines emission information from all five excitation wavelengths.
Instrument configuration - PDF
CellView
The Image technology called CellView makes it possible to produce images without a camera, enabling imaging at real-time speed required for sorting. It is possible to sort based on these imaging parameters and combine them with traditional fluorescent parameters. The image module uses the blue laser (488nm excitation) and produces 3 scatter parameters (FSC, SSC and lightloss) and 3 fluorescent parameters comparable to 10x to 20x magnification on a microscope: GFP-like, PE-like, and PECy7-like. It is now possible to measure imaging features like Eccentricity (how round a particle is), Diffusivity (how concentrated a signal is), and Correlation (how much overlap between 2 fluorochromes), among others.
More information about the imaging features and how to plot them is available on PPMS.
Short video explaining how CellView Technology works.
Examples of experiments ran in the facility
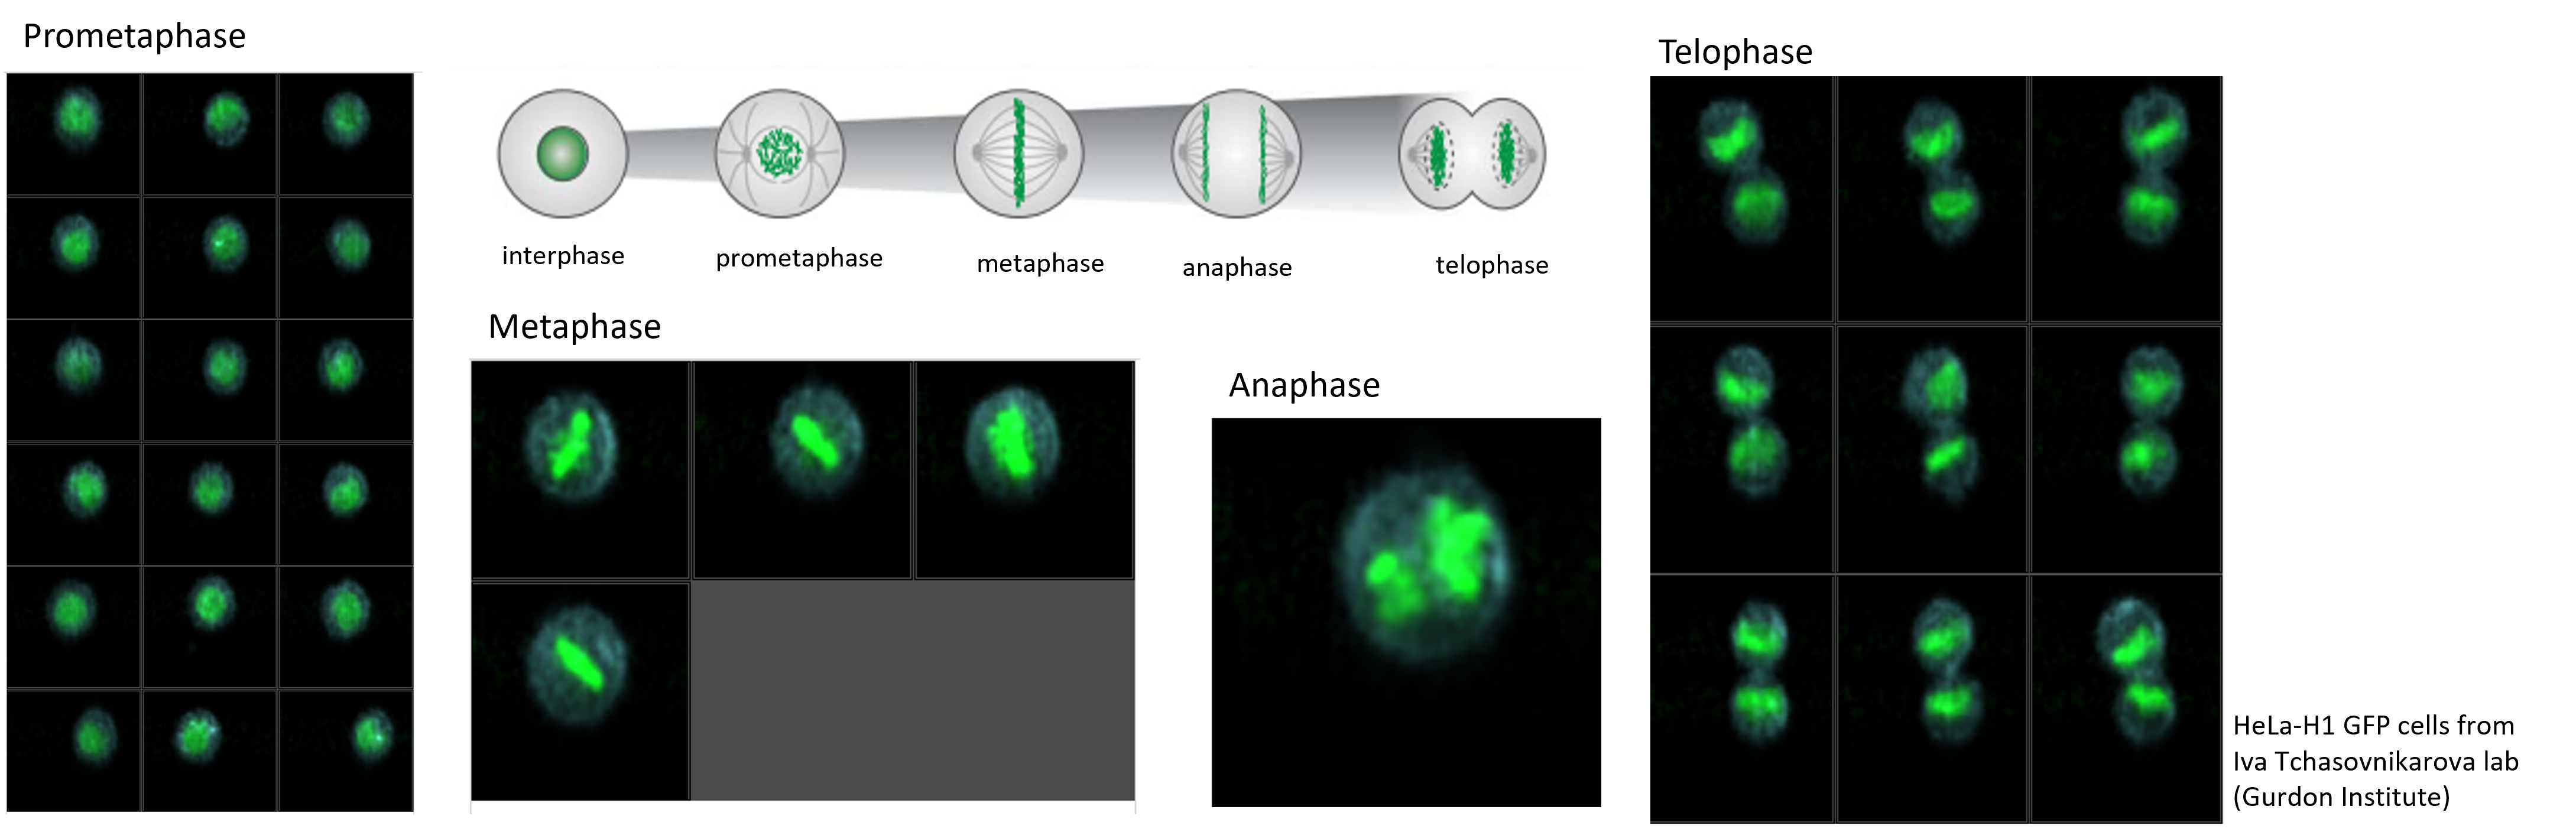
Cell cycle analysis using CellView
One of the first tests we ran on the S8 was trying to replicate the cell cycle analysis published by Schraivogel et al, Science. 2022 Jan 21; 375(6578): 315–320. We sorted live HeLa cells transfected with a histone H1-GFP tag.
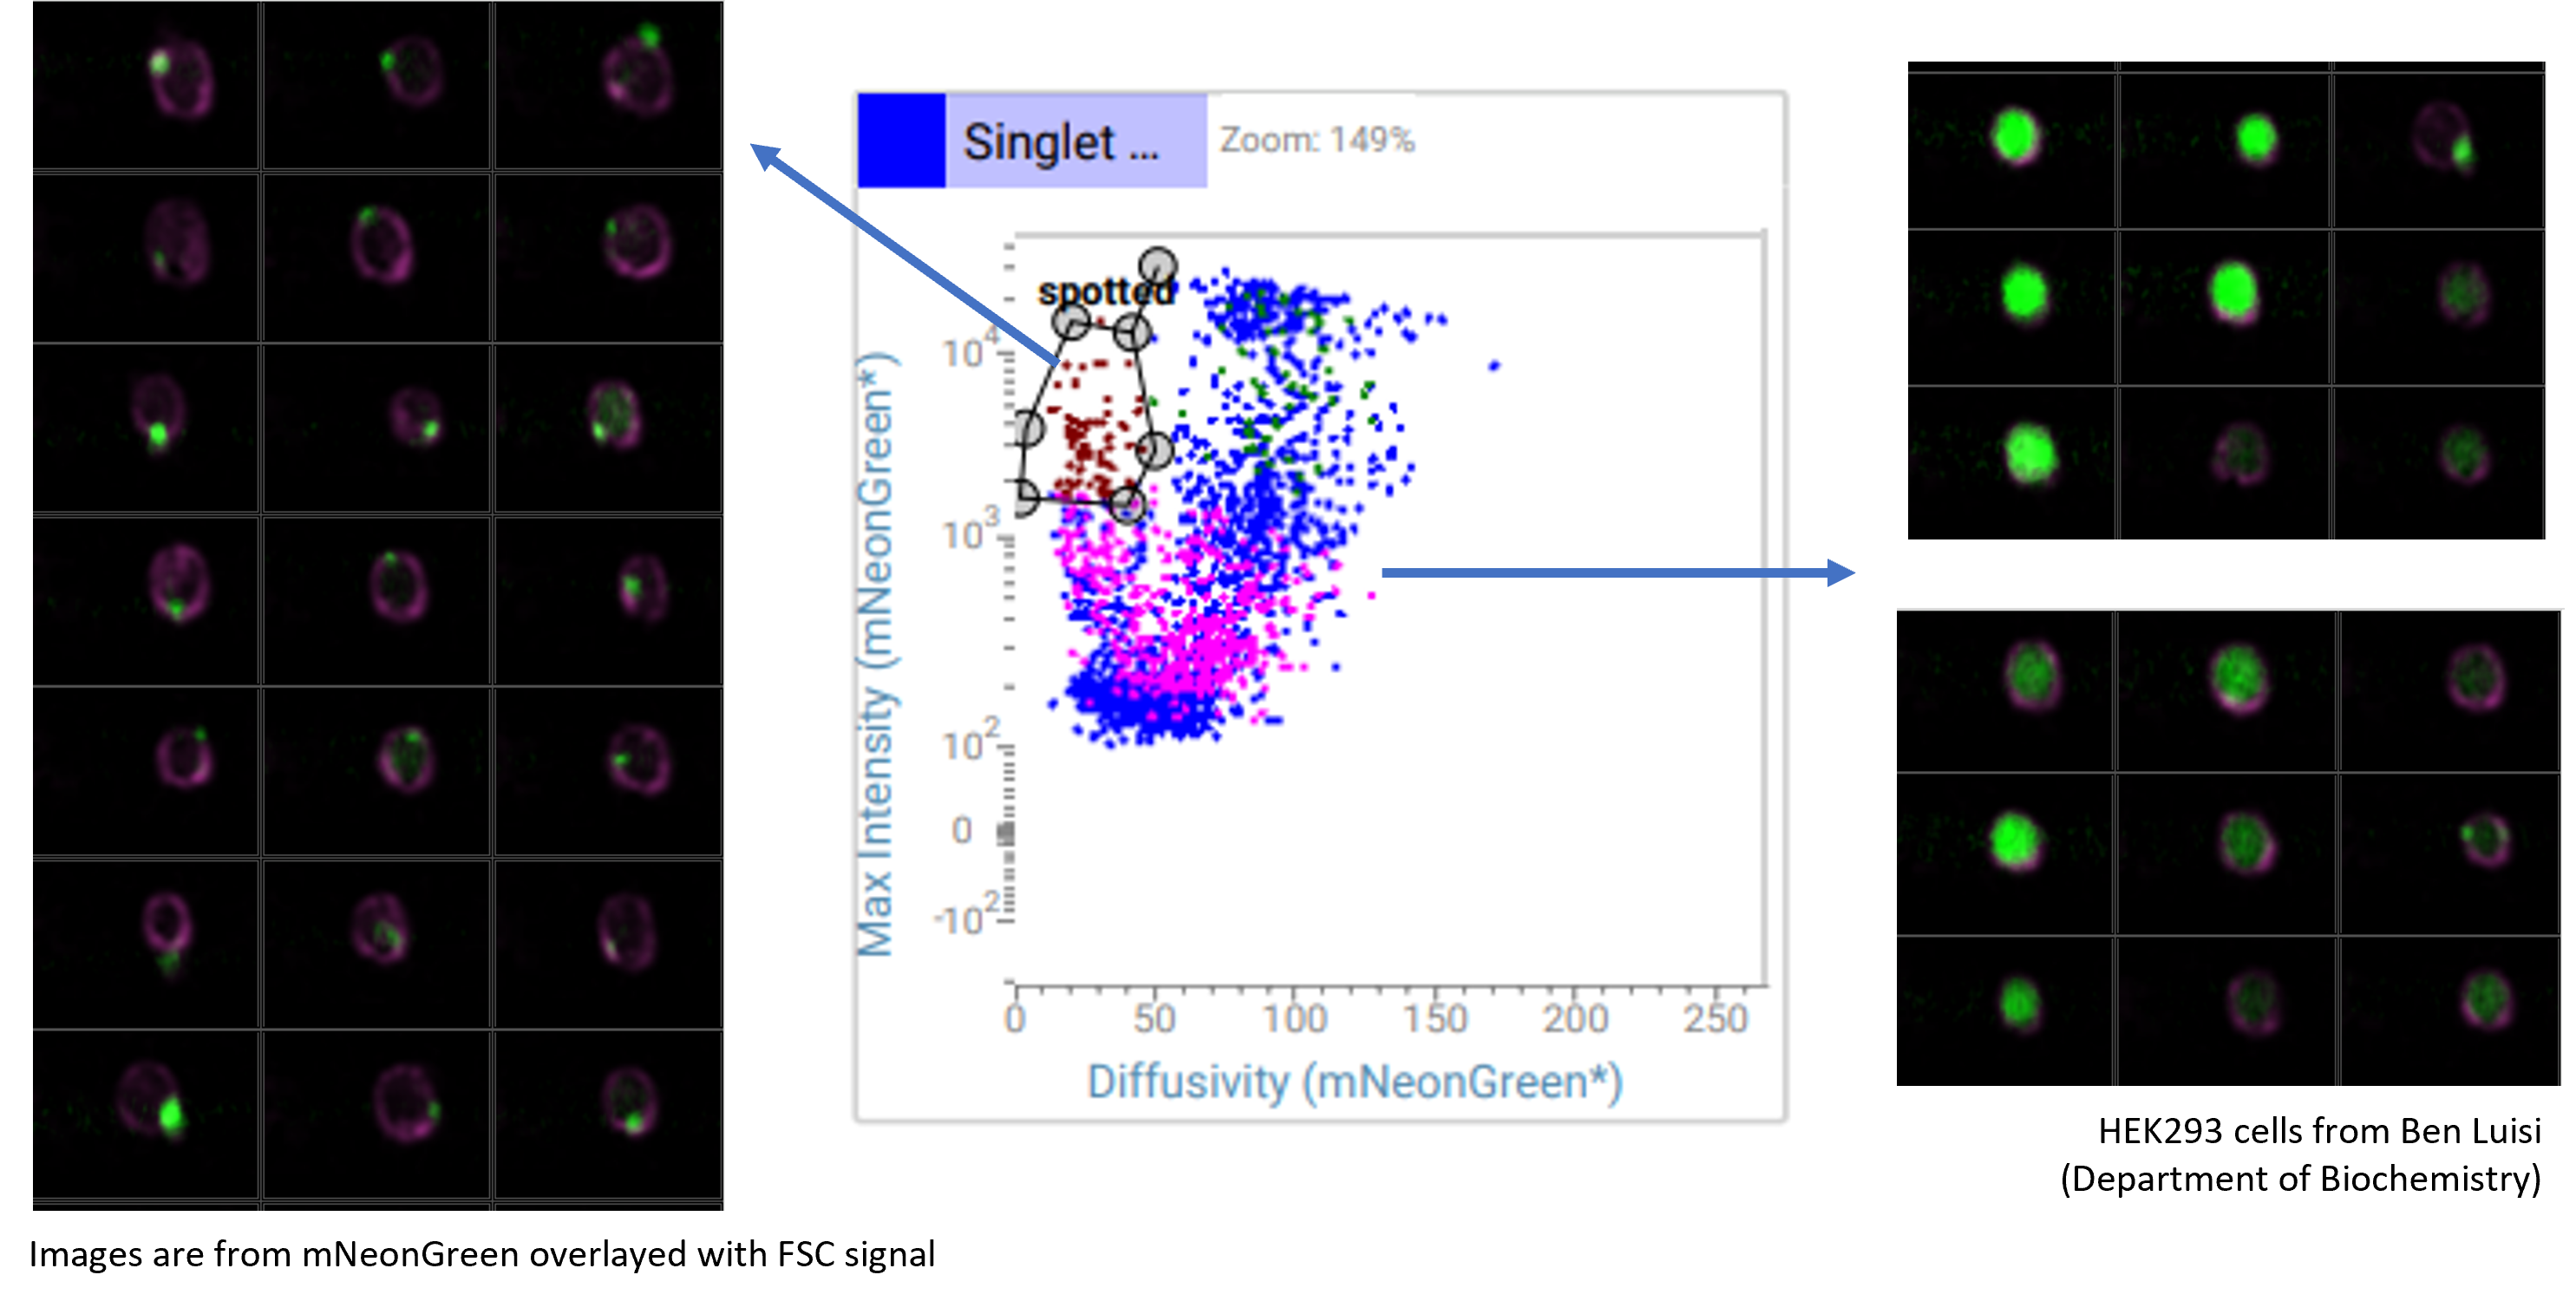
Checking the expression pattern of fluorescent proteins
The CellView technology allows us to 'see' how the distribution of mNeonGreen was in the cell. With traditional plots, we could not identify the sub-population where the fluorescence was clustered and punctated in the cytoplasm. However, by plotting two of the several imaging parameters, we could easily identify and sort these cells.
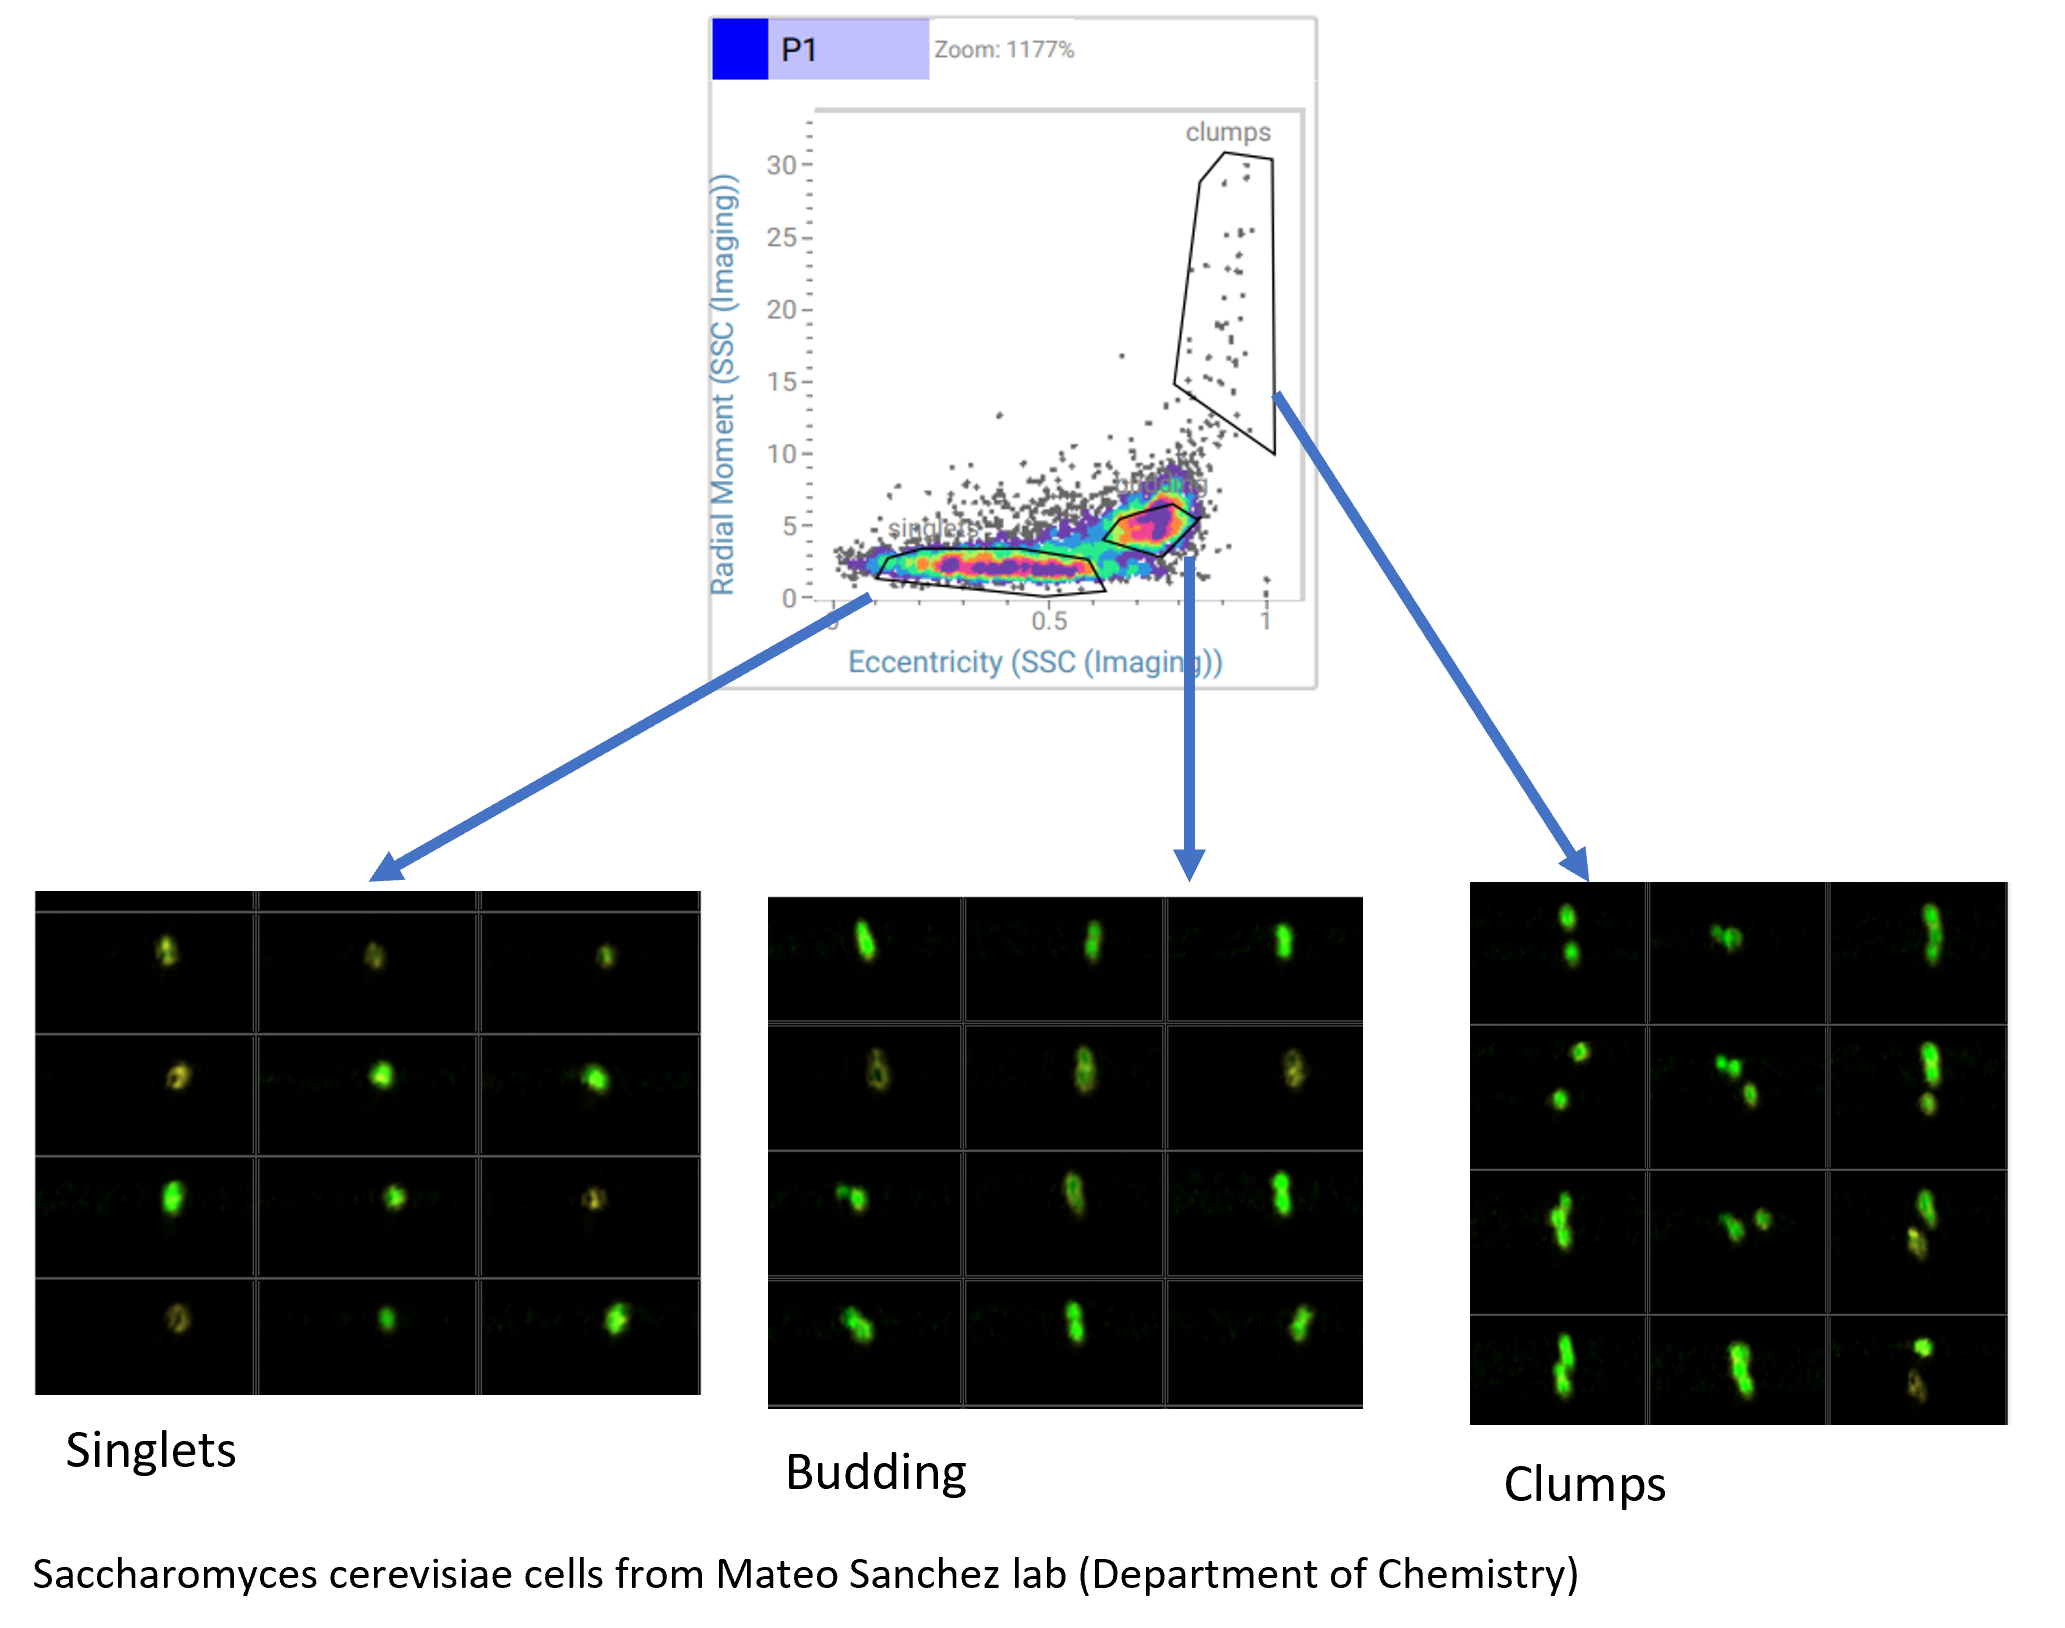
Analysis of budding yeast
Using again the imaging parameters generated by the CellView Technology we were able to separate budding yeast from non-budding yeast and aggregates of cells. In traditional intensity plots, the budding population would be mixed with the non-budding or we would exclude the budding cells in doublet discrimination plots
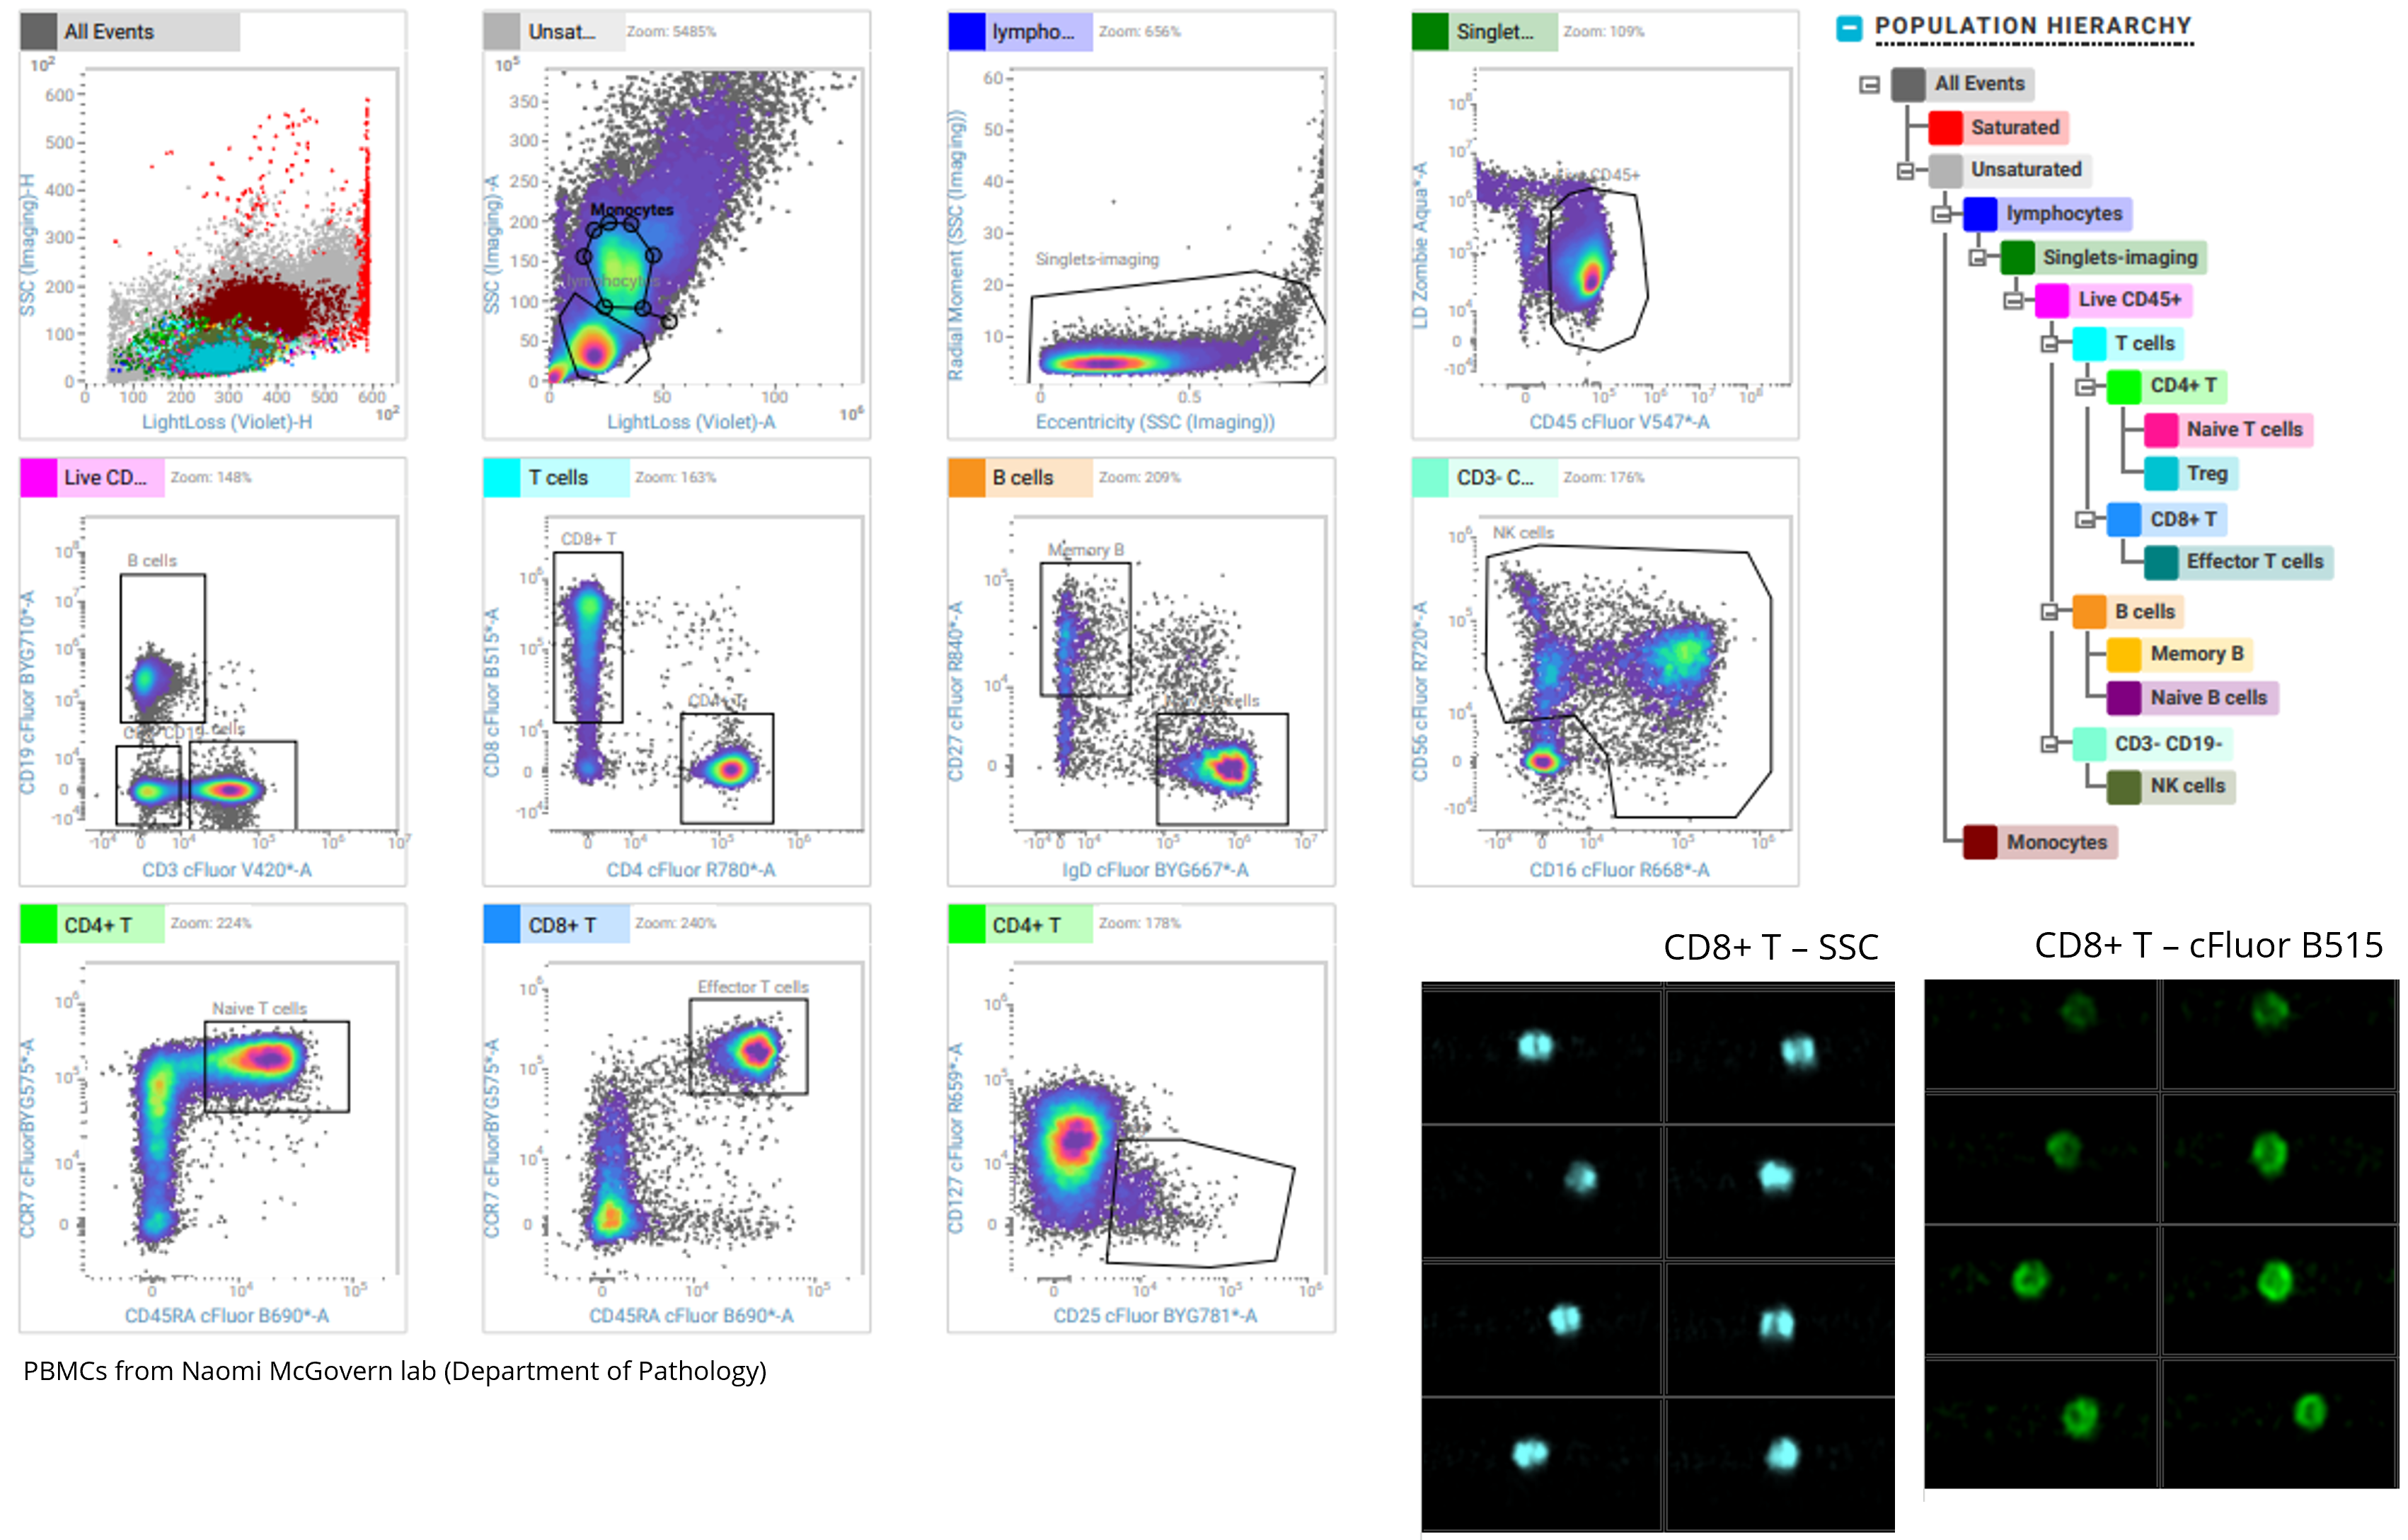
Analysis of Human PBMCs using BD SpectralFX™ Technology
In this example, we used Cytek's cFluor Immunoprofiling Kit 14 Color kit to stain cryopreserved human peripheral blood mononuclear cells. We took advantage of the full spectrum technology to unmix and sort several sub-populations of T and B cells. Using the 85μm nozzle, we can sort up to 6 populations simultaneously.
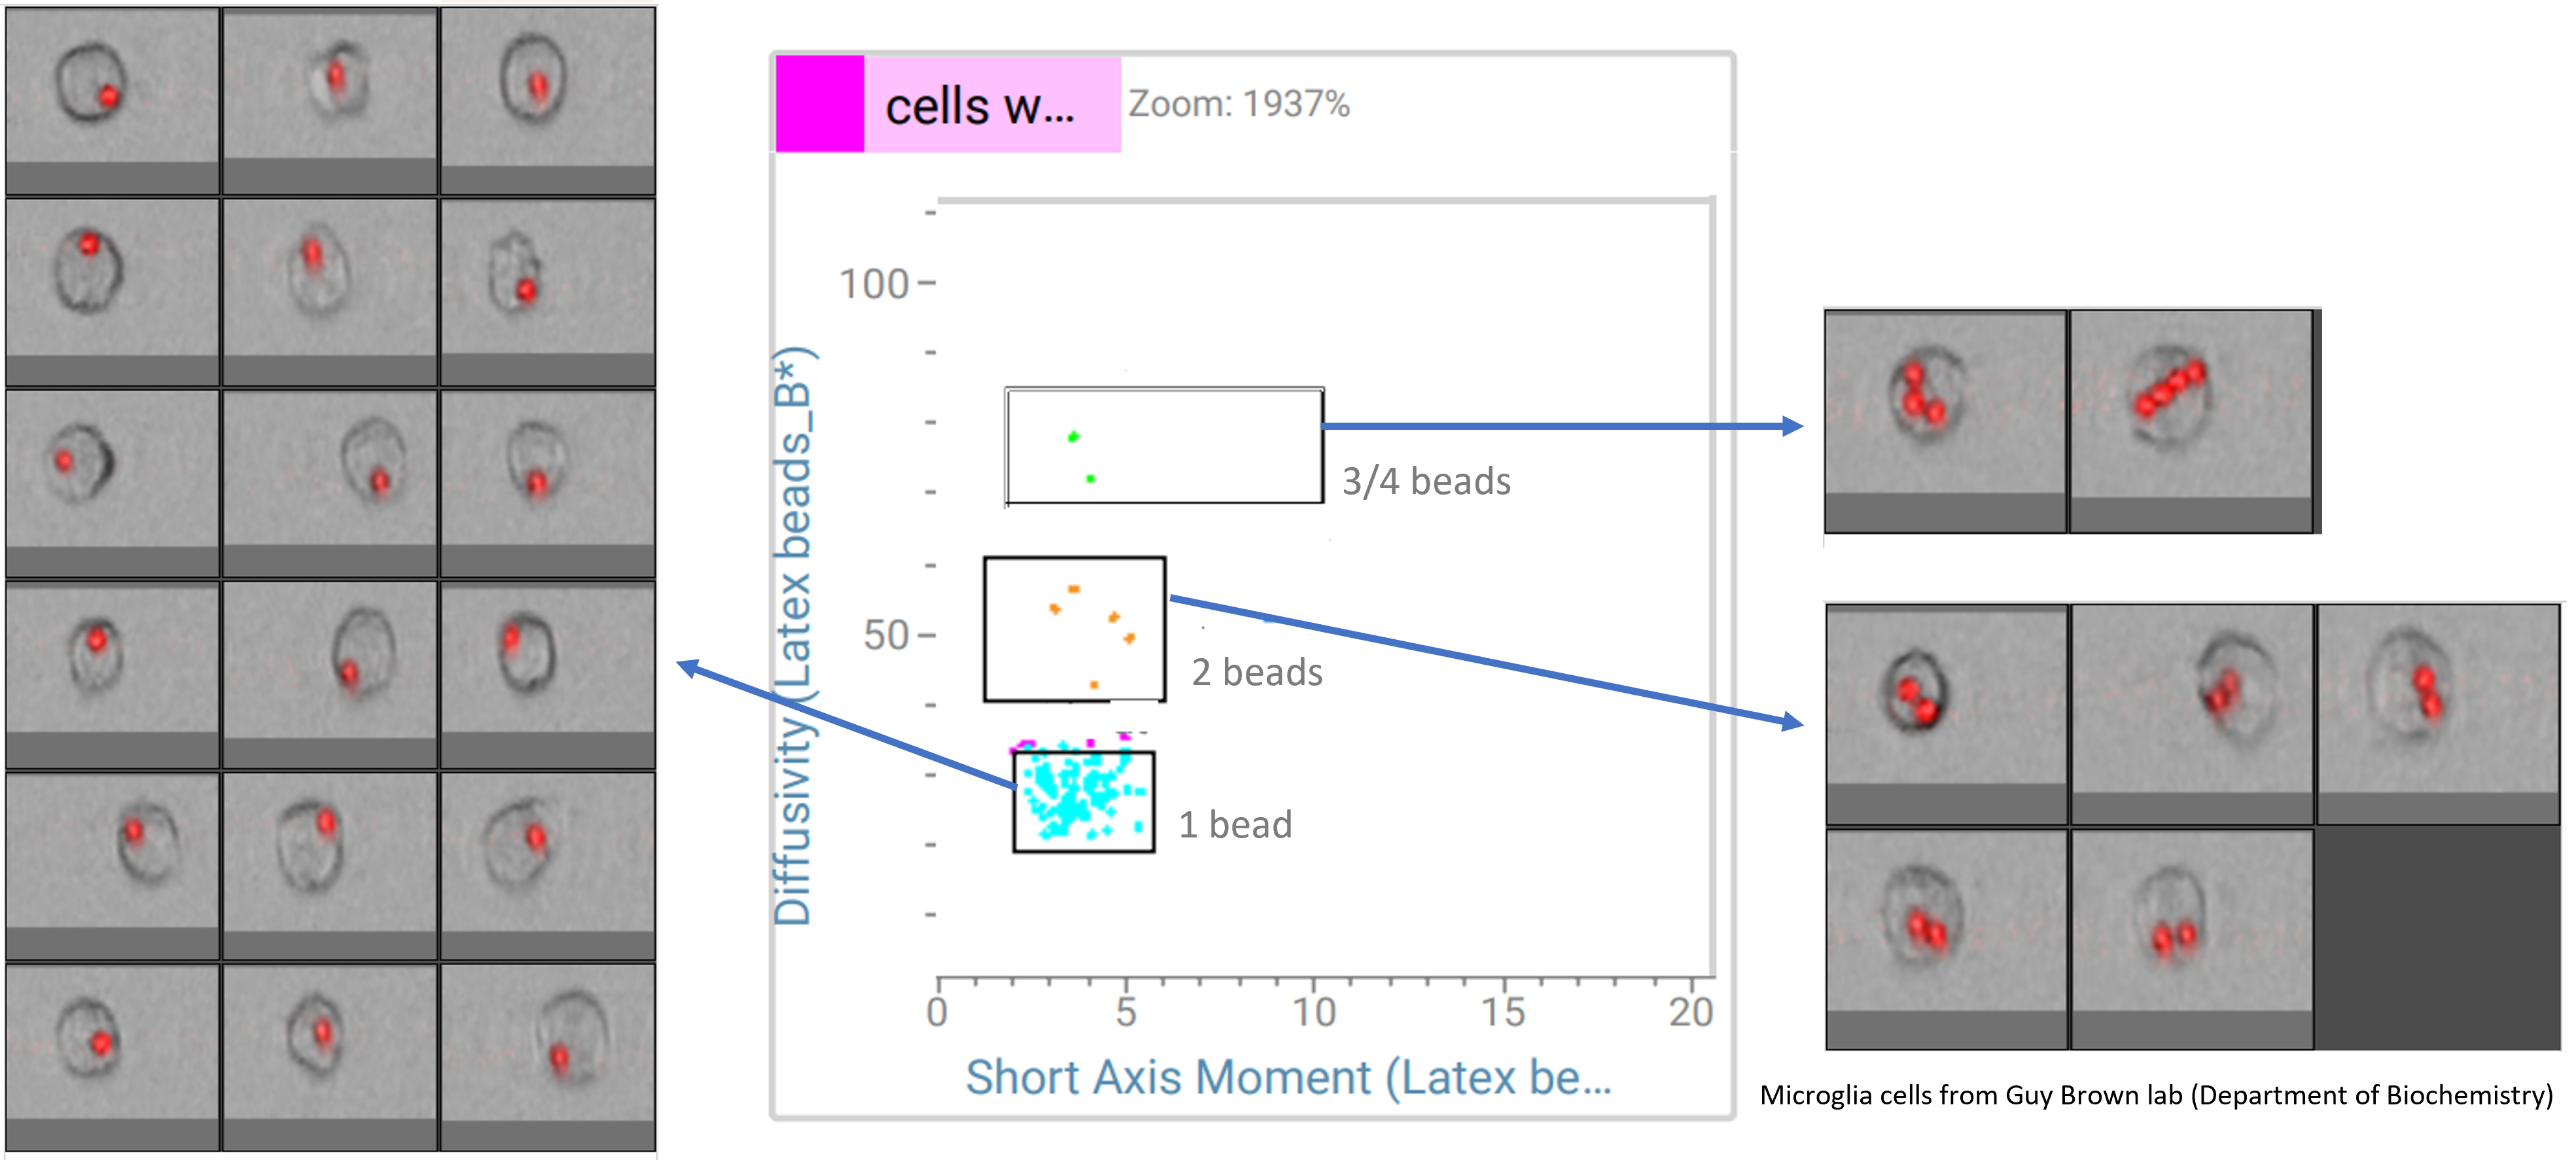
Analysis of phagocytosis using CellView technology
Using the CellView technology and plotting imaging parameters, it was possible to separate microglia cells that ate latex beads
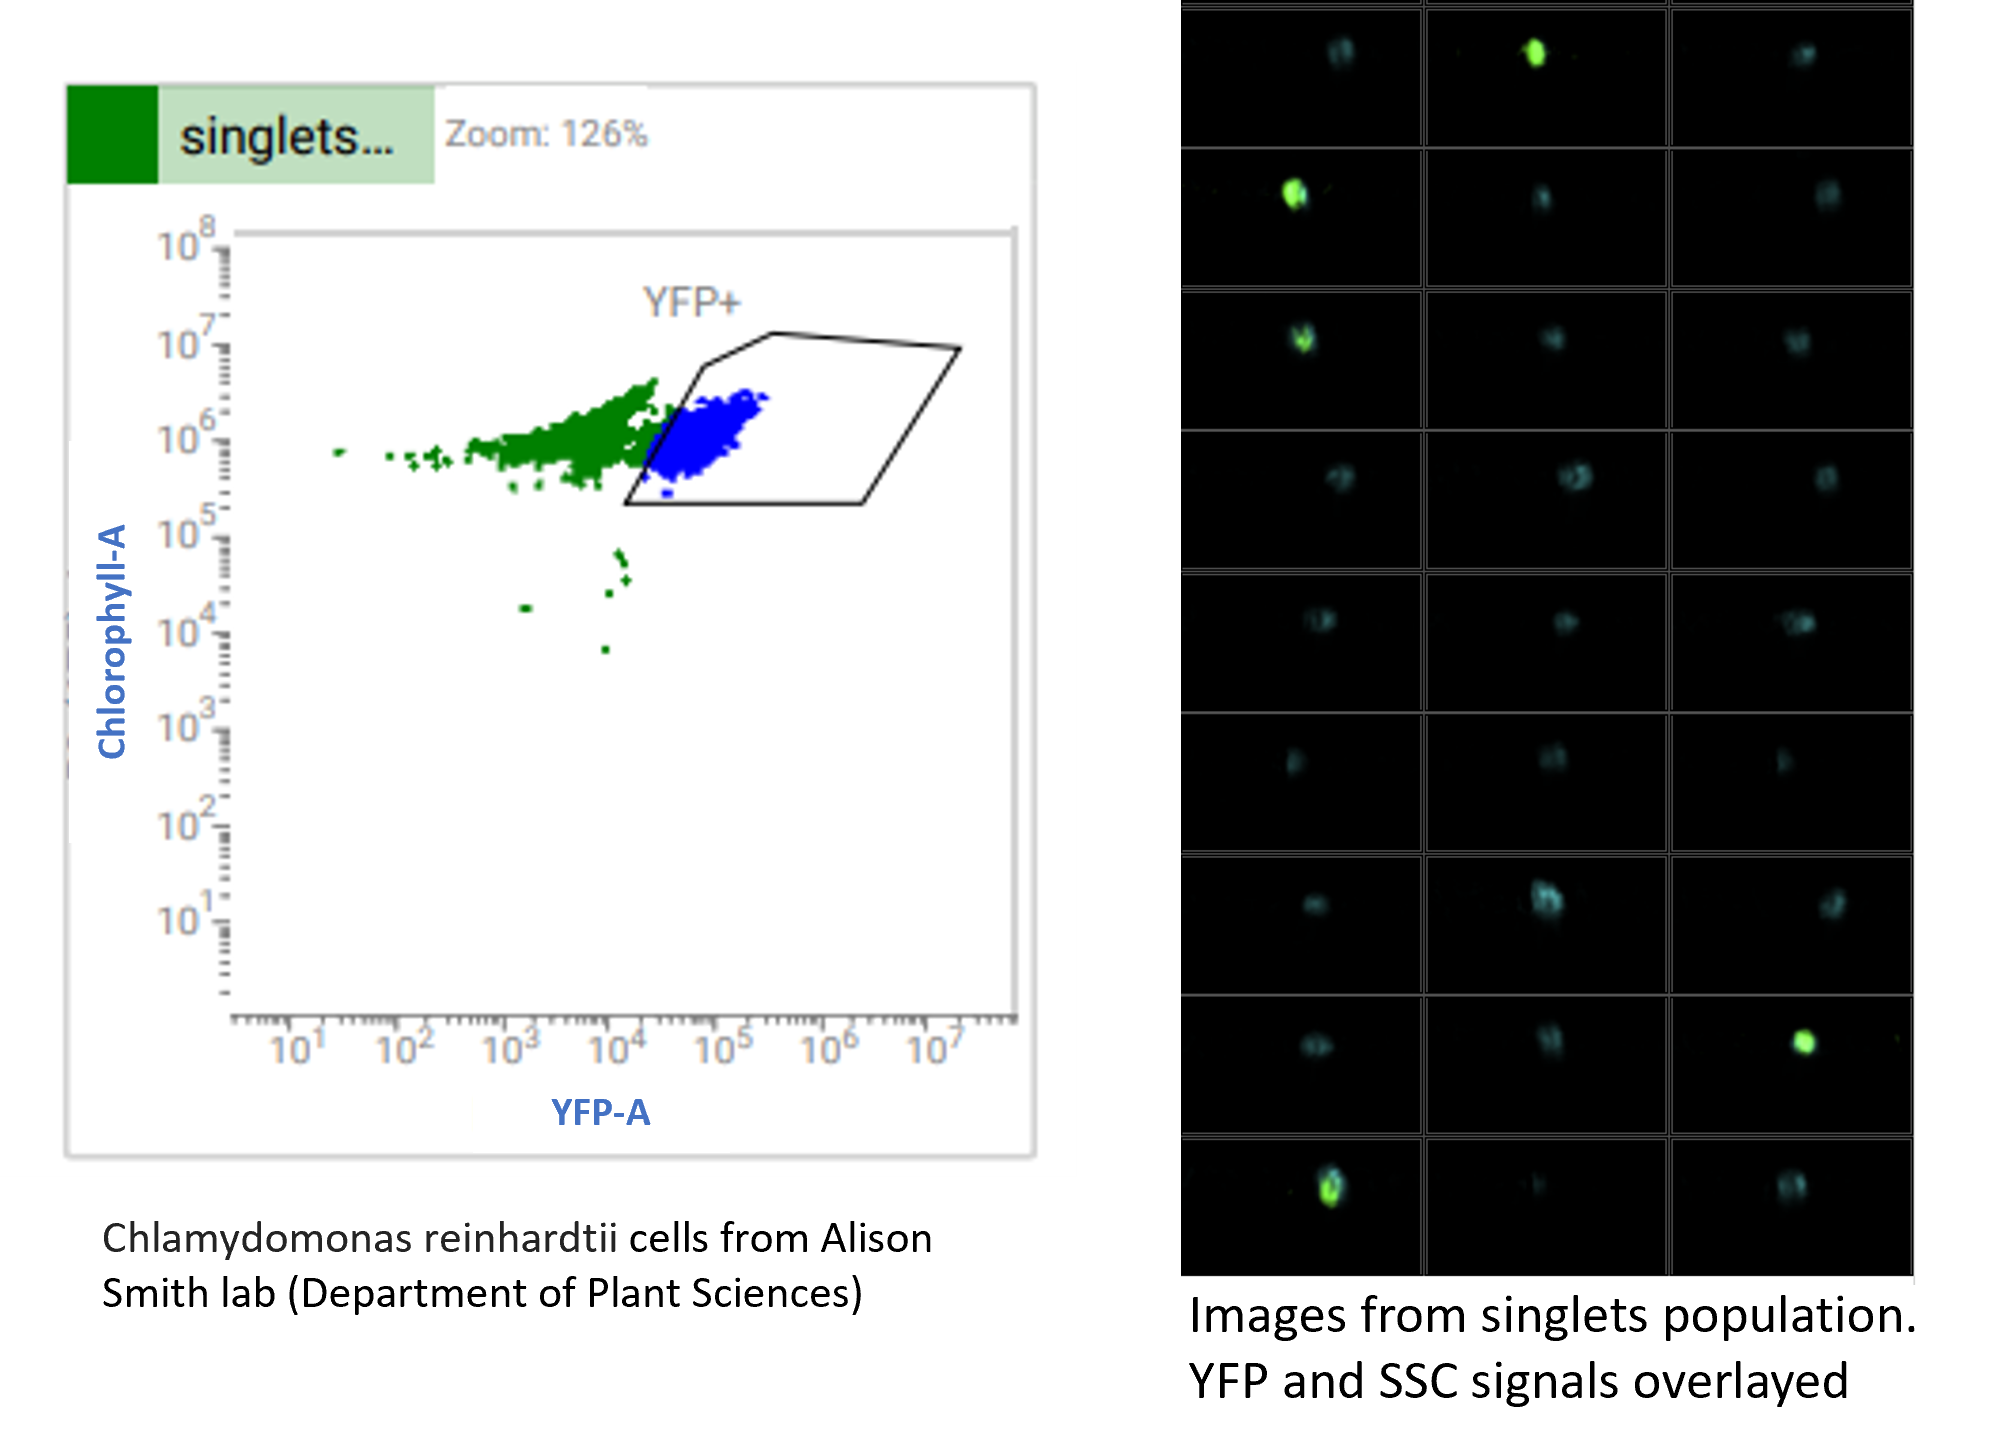
Analysis of environmental samples
We can also use the S8 to look at environmental samples. In this example, we analysed algae cells and looked at the localisation of the YFP signal within those cells.